

Last updated: October 7, 2026
Ontario home sales reached their lowest August level in 25 years in 2026.
That sounds like a strong reason for homeowners to wait before selling.
It is not necessarily that simple.
According to CREA statistics prepared in cooperation with the Ontario Real Estate Association, 13,620 homes sold across Ontario in August 2026. That was 6.0% fewer than one year earlier and 22.6% below the 10-year average for August.
At the same time:
- Ontario’s composite benchmark home price fell 3.6% year over year to $745,400;
- active inventory remained 41.5% above its 10-year August average; and
- months of inventory reached 5.2 months, compared with a long-run August average of only 3.1 months. CREA Stats
Those numbers matter.
They tell us buyers generally have more choice than Ontario homeowners became accustomed to during the province’s more supply-constrained markets.
But they do not tell us that every homeowner should wait.
The Short Answer: Is Ontario in a Buyer’s Market?
Ontario currently has historically weak transaction volume and considerably more resale inventory than its long-run August norms.
That generally creates more negotiating power for buyers.
But calling all of Ontario a single “buyer’s market” oversimplifies the situation.
Conditions vary substantially by:
- municipality;
- neighbourhood;
- property type;
- price range;
- property condition; and
- available competition.
The more useful conclusion is:
Ontario’s provincial data should make sellers more strategic—not automatically make them inactive.
For additional context, buyers and sellers can review where Ontario buyers currently have more negotiating power.
Ontario Home Sales 2026: August Market Snapshot
According to CREA and OREA:
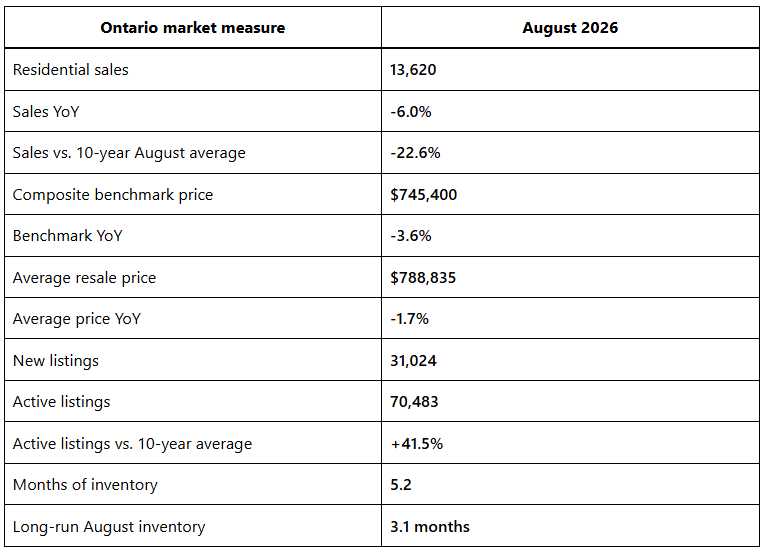
The important story is not any single number.
It is the combination:
historically weak sales + elevated inventory + softer prices.
That creates a very different negotiating environment from the supply-constrained market many Ontario homeowners remember.
Why a 25-Year Sales Low Does Not Automatically Mean a Housing Crash
Sales volume measures how many properties changed hands.
It does not measure how much every Ontario property has lost in value.
Consider the difference.
August sales were 22.6% below their 10-year average.
The benchmark price was 3.6% below August 2025.
Those percentages should not be expected to move together.
They measure different things.
When demand weakens, sellers have several choices.
They can:
- reduce the asking price;
- negotiate;
- wait longer;
- remove the property from the market;
- rent it instead; or
- simply decide not to sell.
Housing markets can therefore adjust through transaction volume first, then through longer marketing periods and changed negotiating behaviour, and potentially through further price adjustment if the imbalance persists.
That sequence is not guaranteed.
But it explains why a dramatic sales headline and a much smaller price decline can occur at the same time.
Ontario Buyers Have More Choice Than the Sales Number Suggests
Ontario finished August with 70,483 active residential listings.
That was actually 3.9% lower than August 2025.
But the historical comparison tells a different story.
Inventory remained:
- 20.4% above the five-year average; and
- 41.5% above the 10-year average. CREA Stats
This is why year-over-year statistics should not be read in isolation.
Inventory can decrease from an unusually high previous year and still remain historically elevated.
For sellers, your competition is therefore not simply:
“What did the neighbour sell for?”
It is:
“What can a buyer purchase instead of my property today?”
What Does 5.2 Months of Inventory Mean in Ontario?
Months of inventory estimates how long it would take to sell current available inventory at the existing sales pace if no additional homes were listed.
Ontario had 5.2 months of inventory in August 2026.
Its long-run August average is approximately 3.1 months.
That is a meaningful difference.
It shows Ontario is considerably less supply-constrained than during stronger seller markets.
But 5.2 months is still a provincial average.
A condominium in one Ontario community could have substantially more competing inventory.
A detached family home in a highly desirable neighbourhood could have significantly less.
That is why I would never price an individual property from the Ontario number.
Use provincial data for context.
Then move immediately to the local market.
Property Type Matters
The provincial price decline was not evenly distributed.
Ontario’s August benchmark prices were:
Single-family homes: $826,900, down 3.4% year over year.
Townhouse/row homes: $585,000, down 5.6%.
Apartment units: $489,200, down 6.4%. CREA Stats
This matters when homeowners hear a headline such as:
“Ontario home prices are down 3.6%.”
Your property category may be performing quite differently from that composite number.
The same principle applies at the neighbourhood level.
There is rarely one market.
There are multiple overlapping markets operating simultaneously.
Geography Matters Just as Much
Ontario’s regional statistics reinforce the point.
In August, Eastern Ontario sales were down 13.9% year over year, while the region’s average price was essentially unchanged.
Central Ontario experienced a smaller decline in transactions but a larger decrease in average price.
Northern Ontario produced another pattern entirely. CREA Stats
None of those results is more “correct” than the others.
They describe different markets.
For an Ottawa homeowner, the analytical hierarchy should become:
Canada → Ontario → Ottawa → neighbourhood → property type → price range → individual property
Every step makes the information more relevant to the actual transaction.
Why Waiting Is Not Automatically the Right Seller Strategy
When home sales are historically weak, saying:
“I’ll wait until the market gets better.”
sounds reasonable.
Sometimes it is.
Sometimes it is not.
The missing variable is usually the homeowner’s next move.
Imagine you sell your current property for less than you hoped today.
But you also purchase your next property at a substantially lower price than it would command in a stronger seller’s market.
Your overall financial position may still improve.
Now consider the opposite.
Suppose your current $800,000 property appreciates by 5%.
You gain $40,000 before transaction costs.
But the $1.2 million property you want next also rises by 5%.
Its price increases by $60,000.
The gap between the two homes becomes $20,000 larger.
That is why move-up buyers should not evaluate only the future value of the property they currently own.
They should evaluate:
the gap between what they own and what they want next.
For downsizers, the numbers may work differently again.
Five Questions to Ask Before Waiting to Sell
1. Why Are You Moving?
A discretionary investment decision may be able to wait indefinitely.
A move driven by family, employment, retirement, school, estate planning or lifestyle may have a much more specific timeline.
Real-estate strategy should serve the underlying life decision.
It should not replace it.
2. What Is Happening in Your Micro-Market?
Ontario sales can be historically weak while your neighbourhood remains relatively competitive.
Your local absorption rate, comparable inventory and buyer demand matter more to your individual transaction.
3. What Property Are You Buying Next?
A softer market may reduce your sale price.
It can also improve your purchasing power on the next property.
Analyze both transactions together.
4. What Does Waiting Cost?
Waiting has potential benefits.
It also carries costs:
- mortgage interest;
- property taxes;
- utilities;
- insurance;
- condominium fees;
- maintenance; and
- the opportunity cost of postponing the next move.
Mortgage conditions matter here as well, which is why homeowners should understand how stable interest rates are shaping Ontario’s housing market.
5. What Specifically Needs to Improve?
Are you waiting for:
- lower mortgage rates?
- higher prices?
- more buyers?
- lower inventory?
- completion of a renovation?
- a job change?
- stronger finances?
Define the condition.
If you do not know what needs to improve before you act, waiting is not yet a strategy.
It is postponement.
What Ontario Sellers Should Do in a High-Inventory Market
When buyers have more alternatives, sellers need to remove unnecessary reasons for buyers to reject the property.
Five areas matter particularly.
Price
The asking price should make sense against current competing inventory, not merely against historical sold prices.
Presentation
Most buyers compare properties digitally before deciding which homes deserve an in-person showing.
Presentation therefore affects whether a listing enters the buyer’s shortlist at all.
Condition
Deferred maintenance becomes easier for buyers to penalize when several substitutes are available.
Marketing
The listing needs to communicate why this property deserves attention over another option at a similar price.
Negotiation
Acceptable pricing, conditions, timelines and financial thresholds should be established before the first offer arrives.
The market determines the realistic range. Strategy influences where within that range the seller ultimately lands.
Sellers in higher-inventory conditions should also review how sellers can stay competitive as inventory rises.
What Ontario Buyers Should Understand
Historically low sales and above-average inventory can create opportunities.
Buyers may have more ability to:
- negotiate price;
- negotiate closing dates;
- include appropriate conditions;
- compare multiple properties;
- complete due diligence; and
- take more time evaluating value.
But a 25-year provincial sales low does not mean every seller is desperate.
Some properties remain highly competitive.
Some sellers have little urgency.
Some neighbourhoods have limited supply.
Good negotiation depends on the specific property, not the provincial headline.
Buyers preparing for a purchase can also review our guide to buying a home in Ontario in 2026.
What About Ontario’s Future Housing Supply?
The resale market is only one part of Ontario’s housing story.
CMHC’s August construction data shows that Ontario’s six-month housing-start trend fell approximately 7% from July to August, from 63,370 to 58,933 units.
The decline came from multi-unit and other housing, where the trend fell 9%, while single-detached starts increased 3%. CMHC
Actual August starts in Ontario centres with at least 10,000 residents were 22% below August 2025, although Ontario’s year-to-date starts through August remained 3% above the comparable 2025 period. CMHC
This does not directly predict resale prices.
Construction and resale housing operate on different timelines.
But today’s development pipeline influences the quantity and types of homes available in future years.
Homeowners making multi-year decisions should therefore monitor both resale inventory and new construction.
Frequently Asked Questions
Is Ontario’s housing market crashing?
The August data shows historically weak transaction volume, elevated inventory and lower benchmark prices, but it does not establish that every Ontario property or municipality is experiencing a housing crash. The composite benchmark declined 3.6% year over year while sales reached their lowest August total in 25 years. CREA Stats
Is Ontario a buyer’s market in 2026?
Buyers have more negotiating leverage in many parts of Ontario because inventory remains high relative to historical norms and sales activity is weak. However, the province should not be treated as one uniform buyer’s market. Local conditions, property type and price range matter.
Are Ontario home prices falling?
Ontario’s composite benchmark price was $745,400 in August 2026, down 3.6% from August 2025. Single-family homes were down 3.4%, townhouses 5.6% and apartments 6.4%. CREA Stats
Why are Ontario home sales so low?
August sales were 22.6% below the province’s 10-year August average while available inventory remained substantially above historical norms. Affordability, borrowing costs, economic uncertainty and greater buyer choice can all influence transaction activity, but provincial figures alone cannot explain every individual market.
Should Ontario homeowners wait until 2027 to sell?
There is no provincewide answer. The decision should account for your local market, equity, mortgage position, reason for moving, carrying costs and the property you plan to purchase next.
Does higher inventory mean I need to lower my price?
Not automatically. Higher inventory means buyers have more alternatives, which makes competitive pricing more important. Whether a particular property needs a price adjustment depends on local competition, showing activity, recent sales, condition and buyer response.
Anna’s Perspective
Ontario’s lowest August home-sales total in 25 years deserves attention.
It does not require panic.
And it should not be ignored.
The numbers tell us that buyer behaviour has changed.
Transactions are historically weak.
Inventory remains elevated.
And sellers are competing for buyers who often have more alternatives.
That makes strategy more important—not less.
For sellers, the question is no longer simply:
“What did my neighbour sell for?”
It is:
“What can my buyer choose instead today, and how do we position my home against those options?”
For buyers, the question is not:
“How low can I offer?”
It is:
“Where does the current market actually give me leverage?”
Those questions lead to better decisions.
If you are considering selling and want to understand what the Ontario shift means for your individual property, neighbourhood and price range, request a free home evaluation based on current comparable-market information.
Ontario statistics tell us what is happening.
Local numbers tell us what to do about it.
— Anna Alemi
Sources and data note
Ontario resale statistics in this guide are based on CREA data prepared in cooperation with the Ontario Real Estate Association for August 2026, currently the latest provincial report available as of October 7, 2026. Construction data comes from CMHC’s August 2026 housing-start release. Market statistics describe broad reported conditions and are not an appraisal or guarantee of future results. CREA stats CMHC