

Last updated: October 7, 2026
Ottawa’s fall real estate market is sending a more complicated signal than a simple “up” or “down” headline can explain.
Home sales fell sharply in August, declining 18.6% from a year earlier. In September, sales stabilized rather than falling again.
But another part of the market weakened.
New listings surged, inventory increased and Ottawa’s benchmark home price declined.
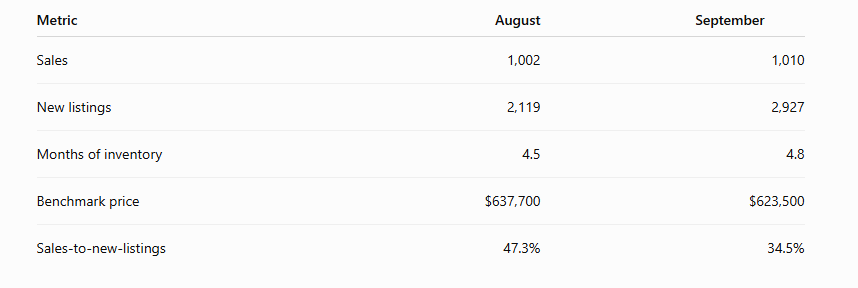
According to the Ottawa Real Estate Board’s September 2026 market report, 1,010 homes sold, only slightly more than the 1,002 transactions recorded in August. At the same time, 2,927 new listings entered the market—38.1% more than in August.
The result was a market giving buyers substantially more choice without a corresponding increase in completed sales.
That distinction matters for anyone trying to understand Ottawa home sales in fall 2026.
The market is not collapsing.
But the balance between buyers and sellers has shifted.
The Short Answer: Is the Ottawa Housing Market Falling?
Ottawa’s market has softened.
That does not mean every home is losing value or that every neighbourhood is behaving the same way.
September sales were down 6.6% year over year, but essentially unchanged from August. The larger change occurred on the supply side.
New listings increased sharply, active inventory rose and months of inventory reached 4.8 months.
At the same time:
- the average sale price declined 1.0% year over year;
- the median sale price declined 0.8%; and
- the composite benchmark price declined 0.3%.
More importantly, the benchmark price fell 2.2% from August to September.
So the most accurate description is:
Ottawa’s sales pace stabilized in September, but weaker absorption and growing supply are beginning to create more visible pressure on prices.
Ottawa Housing Market: September 2026 Snapshot
According to OREB:
| Ottawa market measure | September 2026 |
|---|---|
| Residential sales | 1,010 |
| YoY sales change | -6.6% |
| Average sale price | $685,640 |
| Median sale price | $625,000 |
| Composite benchmark price | $623,500 |
| Active listings | 4,813 |
| New listings | 2,927 |
| Months of inventory | 4.8 |
| Sales-to-new-listings ratio | 34.5% |
| Median days on market | 27 days |
The most important number may not be price.
It may be the 34.5% sales-to-new-listings ratio.
That means roughly one property sold for every three new listings entering the market during September.
Months of inventory also increased from 3.5 in July → 4.5 in August → 4.8 in September. Ottawa Real Estate Board
That progression tells us supply is being absorbed more slowly.
What Changed Between August and September?
August delivered the initial warning.
Only 1,002 homes sold, an 18.6% year-over-year decline, while months of inventory jumped to 4.5.
Prices, however, remained comparatively stable. Ottawa’s August benchmark price was $637,700, still 1.0% higher than the previous year.
September changed the picture.
Sales stopped falling month over month.
But new listings increased far faster than sales.
That pushed active inventory higher and weakened absorption further.
At the same time, the composite benchmark dropped to $623,500.
So August’s story was:
Sales weakened faster than prices.
September’s story is:
Sales stabilized, but the growing imbalance between supply and demand is beginning to show more clearly in benchmark pricing.
That is a meaningful evolution.
August → September comparison graphic:
Broader Ottawa real estate market trends
The Price–Pace–Inventory Framework
When market statistics appear contradictory, I encourage homeowners to separate three different things:
price, pace and inventory.
1. Price: What Are Buyers Actually Paying?
There is no single perfect measure of Ottawa home prices.
The average price in September was $685,640.
The median was $625,000.
The MLS Home Price Index composite benchmark was $623,500.
Average and median prices can change depending on which types of properties happened to sell.
The HPI attempts to reduce that effect by tracking a representative home with more consistent characteristics.
That is why September’s benchmark movement deserves attention.
It does not prove that every Ottawa property suddenly lost 2.2% of its value.
2. Pace: How Many Buyers Are Actually Purchasing?
September recorded 1,010 sales.
That was:
- 6.6% below September 2025;
- 0.8% above August 2026.
The month-over-month increase is notable because sales usually decline from August to September.
But one month of stabilization should not be interpreted as a full market rebound.
Looking at July through September together, Ottawa recorded 3,336 sales, 8.2% fewer than during the same period last year and the third-lowest summer total since 2016.
3. Inventory: How Much Competition Does a Seller Face?
This is where September changed most dramatically.
New listings jumped 38.1% from August.
Active listings climbed to 4,813.
Months of inventory reached 4.8.
That means sellers are competing for approximately the same number of buyers against a larger pool of available properties.
For homeowners, that changes strategy.
Stable citywide prices do not automatically mean an individual seller still has strong pricing power.
Why Can Sales Slow Before Prices Fall?
Sales volume and property values measure different things.
Transaction activity can weaken first.
Buyers may become more selective.
Properties may take longer to sell.
Sellers may resist reducing their expectations.
Some homeowners may decide not to sell at all.
Price discovery therefore does not always happen immediately.
That is exactly why August’s 18.6% sales decline did not produce an equivalent decline in home prices. Your original August analysis correctly identified that market pace weakened considerably faster than property values.
September suggests that some of that pressure may now be reaching the price side of the market.
Whether that becomes a sustained trend depends on what happens through October and November.
Ottawa Is Not One Housing Market
Citywide averages remain useful.
But homeowners do not sell averages.
They sell specific properties.
September again showed major differences between property types.
Single-family homes
Single-family properties recorded approximately 4.4 months of inventory.
Their benchmark price was $705,100, nearly unchanged from a year earlier, although down 3.0% from August.
Townhouses
Townhouses recorded approximately 4.0 months of inventory.
Their benchmark price was $546,500, down 2.2% year over year.
Apartment condominiums
Apartments remained the softest major segment.
They recorded:
- 7.3 months of inventory;
- a 27.0% sales-to-new-listings ratio; and
- a benchmark price of $380,800, down 6.1% year over year. https://www.oreb.ca/newsroom/2026/10/
This is why homeowners should understand how detached homes, townhomes and condos are performing differently rather than assuming Ottawa’s overall statistics describe their property.
Geography also matters.
Ottawa Suburb West recorded 3.7 months of inventory, while Ottawa Centre reached 6.8 months. Several rural submarkets were also above six months.
Your real market is:
property type + neighbourhood + price range + current competition.
What the Fall 2026 Market Means for Ottawa Sellers
The biggest mistake I would avoid right now is assuming that a relatively stable average price means every homeowner still has strong pricing power.
Buyers have more choices.
They can compare properties more carefully.
And increasingly, sellers are competing for the same buyer.
Before listing, I would want answers to five questions:
- What can a buyer purchase instead of my home?
- How many genuine competitors exist in my price range?
- How quickly is that inventory being absorbed?
- Which comparable listings recently failed to sell?
- What price position gives my property the strongest competitive advantage?
In a market with increasing inventory, the first weeks of exposure become particularly important.
The objective is not simply to choose the highest asking price that can be defended.
The objective is to become one of the most compelling options in the buyer’s comparison set.
Homeowners preparing to sell should also understand how Ottawa sellers can stay competitive as inventory rises and properly prepare their home for sale in Ottawa before launching.
Should Ottawa Sellers Lower Their Price?
Not automatically.
A citywide slowdown does not mean every listing needs an immediate price reduction.
A strong detached home competing against limited local inventory may behave very differently from an apartment condominium with numerous substitutes.
Before recommending a price change, I would examine:
- showing activity relative to the competition;
- buyer feedback;
- new listings entering the immediate market;
- recent sales;
- local absorption;
- days on market; and
- whether competing properties have adjusted their prices.
If buyers are viewing a property but consistently refusing to make offers, they may be questioning value.
If buyers are not booking showings at all, the issue could involve price, presentation, marketing, property characteristics—or several of those factors simultaneously.
Diagnose the problem before choosing the solution.
What the Fall Market Means for Ottawa Buyers
Buyers have gained something valuable:
choice.
September’s increase in listings gives many buyers more opportunity to compare homes, complete due diligence and negotiate than they would have in a severely supply-constrained market.
But Ottawa is still highly segmented.
An apartment buyer with 7.3 months of inventory may have very different leverage from a buyer pursuing a desirable detached home in a tighter suburban segment.
Instead of assuming every seller will negotiate aggressively, look for evidence.
Examine:
- days on market;
- price reductions;
- previous unsuccessful listings;
- competing inventory;
- property condition;
- recent comparable sales;
- seller motivation where legitimately known; and
- neighbourhood-specific absorption.
The objective is not simply to negotiate harder.
It is to understand where leverage genuinely exists.
Should You Sell Now or Wait?
There is no universal answer.
A homeowner selling into a softer market may also be buying their next property in that same softer environment.
That matters.
Suppose your current home’s value increases while you wait.
If the property you intend to buy increases by even more, waiting did not necessarily improve the move.
Instead of asking:
“Is this the perfect time to sell?”
ask:
“What does the entire move look like financially if I sell now compared with six or twelve months from now?”
Model:
- expected sale proceeds;
- remaining mortgage balance;
- transaction expenses;
- cost of the next property;
- financing;
- carrying costs;
- timing risk; and
- lifestyle impact.
That decision is more useful than trying to predict a single future Ottawa price.
Frequently Asked Questions
Are Ottawa home prices falling in fall 2026?
September showed clearer price softness than August. Ottawa’s composite benchmark price was $623,500, down 0.3% from September 2025 and 2.2% from August. Average and median prices were also slightly below their year-earlier levels. One month does not establish a sustained price trend, however. Ottawa Real Estate Board
Is Ottawa currently a buyer’s market?
Conditions have shifted more in buyers’ favour, but Ottawa should not be treated as one uniform market. September’s citywide sales-to-new-listings ratio fell to 34.5% and months of inventory reached 4.8, while individual property types and submarkets ranged from considerably tighter to much softer conditions. Ottawa Real Estate Board
Why did Ottawa home sales fall 18.6% in August?
August experienced a substantially larger-than-normal seasonal drop in sales. OREB reported 1,002 transactions, down 18.6% year over year and 24.4% from July. September sales subsequently stabilized at 1,010. Ottawa Real Estate Board
Are Ottawa condos weaker than detached homes?
At the citywide level, yes. In September, apartments recorded 7.3 months of inventory and a benchmark price 6.1% below the previous year. Single-family homes recorded 4.4 months of inventory and a benchmark that was nearly unchanged year over year. Individual buildings and neighbourhoods can still differ significantly. Ottawa Real Estate Board
Will Ottawa home prices keep falling?
No one can determine that reliably from one or two months of data. Future conditions will depend on inventory, sales activity, financing costs, economic conditions, buyer confidence and the specific property segment. OREB itself notes that September’s benchmark decline warrants attention but does not establish a sustained trend. Ottawa Real Estate Board
Anna’s Perspective
August told us Ottawa had become a slower market.
September tells us something more.
It is becoming a more discriminating market.
There are still buyers.
There are still homes selling.
But supply is competing harder for those buyers, and the difference between a correctly positioned property and an incorrectly positioned one is becoming more consequential.
For homeowners, citywide statistics should therefore be the beginning of the analysis—not the conclusion.
Your:
property type + neighbourhood + competition + price range
determine your actual market.
If you are considering selling this fall, a property-level analysis should look at your recent comparable sales, current competition, local absorption, unsuccessful listings and realistic pricing range.
That gives you something far more useful than an Ottawa-wide average:
a strategy built around your actual home.
— Anna Alemi